Around this time last year I published a detailed primer decomposing the drivers of return on equity (ROE) using the DuPont Analysis. That primer included several financial ratios, discussed enough of the balance sheet to understand the connection between debt, return on assets (ROA), and ROE, and even included six quotes from Warren Buffett on how ROE is one of his preferred measures of business and managerial performance! For a more complete list of Warren Buffett stock-picking quotes, please click here.
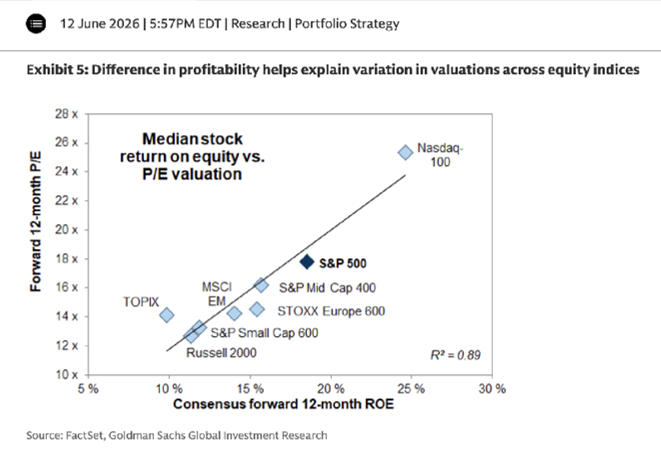
Then recently on June 12, 2026, Ben Snider and his team at Goldman Sachs published a report showing that there is a very high correlation (R2 of 0.89) between ROE and price-to-earnings (P/E) ratios. In other words, businesses with sustainably higher ROE trade at justifiably higher P/Es.
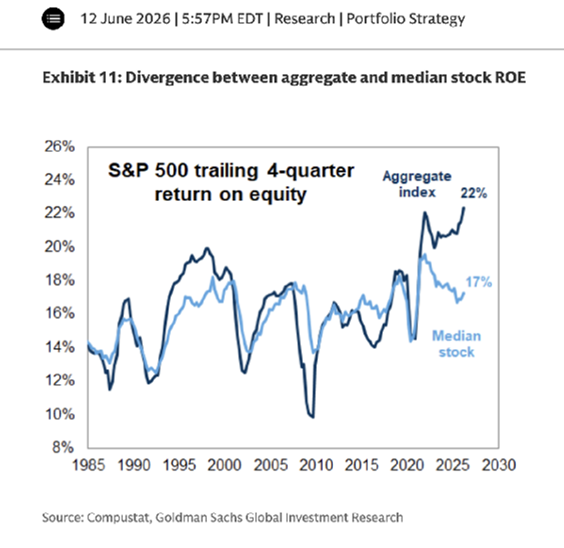
In the same report, Goldman Sachs shows that the trailing twelve month (TTM) average and median ROE of the S&P 500 are 22% and 17%, respectively. The 22% aggregate (average) ROE of the S&P 500 is an all-time record high. The record ROE at the index level has been driven by higher corporate profit margins (partly driven by lower tax rates and lower borrowing costs) and higher ROE at the Mag 7 (which are some of the highest quality, most competitively-advantaged businesses in the world).
So, I thought now would be a good time to share the 2025 average ROE of the Bastion Industrial and Infrastructure portfolio to see how we compare on this measure of business profitability.
But before I share the average ROE of the Bastion Industrial and Infrastructure portfolio, I’d like to highlight some quotes from the DuPont Analysis primer…
- “Return on Equity (ROE) is one of the most common measures of profitability, business quality, and managerial performance. Many (and maybe even most) “quality” mutual funds and ETFs incorporate ROE as a key measuring tool and screening criteria.”
- “Sustainable ROE is a driver of earnings per share (EPS) growth, and long-term stock returns are highly correlated to EPS growth (in other words stocks follow earnings higher over time).”
- “To perform a DuPont analysis, you only need four numbers, two line items from the income statement (sales, which is the top line of the income statement, and net income, which is the bottom line of the income statement) and two line items from the balance sheet (total assets and shareholder equity). The DuPont analysis decomposes the three drivers of ROE into (1) net income margins, (2) asset turnover, and (3) the leverage ratio.”
- “Net income margins are calculated as net income divided by sales and are a measure of profitability. Asset turnover is calculated as sales divided by total assets and is a measure of balance sheet efficiency. And the leverage ratio is calculated as total assets divided by shareholder equity. You can see that sales cancel out and total assets cancel out, so ROE is calculated as net income over shareowner equity. The DuPont formula says that a company’s high ROE could be driven by high net profit margins or high asset turnover (balance sheet efficiency) or high debt or some combination of all three.”
- “While some companies do have high net profit margins and high asset turnover, that is rare. Rather many companies that have really high net income margins have lower asset turnover and companies that have really high asset turnover tend to have lower net income margins. But a select few companies do have both.”
- “The third driver (the leverage ratio) is sometimes referred to as the “equity multiplier.” To understand why, we need to briefly review the balance sheet. The balance sheet is called the balance sheet because assets equal liabilities plus shareholder equity. That equation must always “balance.” The liabilities and owner’s equity are sources of capital (funds) and the assets are the uses of capital. In other words, a corporate management team (the CEO, CFO, etc.) uses capital from debt holders and equity holders to invest in assets with the hope/expectation that those assets will generate enough earnings (profit) to earn an adequate return on those assets (ROA). If Company A has $1 million in assets and $500,000 in shareholder equity, then we know it also has $500,000 in liabilities (debt) because remember that A = L + E. And that’s an asset-to-equity ratio of 2x. But now let’s assume Company B also has $1 million in assets but only has $200,000 of equity. Now it has $800,000 in debt (liabilities) and the asset-to-equity ratio jumps to 5x. In other words, company A and B both have $1 million in assets on the balance sheet, but company B is funding those assets with a lot more debt. And more debt means less equity (because remember the equation must balance) and equity is the denominator in the return on equity formula. And assuming the numerator (net income) doesn’t shrink, then a smaller denominator (smaller equity base) will lead to a higher ROE. And that is why debt can boost ROE and that is why the asset-to-equity ratio is also called the “equity multiplier.”
- “Here is another way to think about the equity multiplier. Remember that management teams use debt capital and equity capital to buy assets with the hope of generating a high-enough return on assets (ROA). Well ROA is calculated as net income divided by total assets so ROE can just be thought of as ROA multiplied by leverage. So, management teams can take a lower ROA and use leverage to generate a higher (in some cases much higher) ROE. But remember that the use of debt should be prudent. Moderate debt can boost returns to equity holders (and that’s a good thing), but too much debt can lead to financial distress and possibly financial ruin (and that’s a bad thing).”
Ok, so here is how the twenty-two stock Bastion Industrial and Infrastructure portfolio performed on ROE using year-end 2025 numbers. Remember that ROE is a measure of business profitability and a driver of earnings per share (EPS) growth (when the ROE is sustainable), not a measure of stock or portfolio performance (returns).
- In 2025, the Bastion Industrial and Infrastructure portfolio generated an average ROE of 35%, which is 1300 basis points higher than the current (record-high) TTM ROE of the S&P 500 of 22%.
- Dupont analysis shows that the drivers of the 35% ROE were average net income margins of 21%, average asset turnover of 0.75, and average assets-to-equity (equity multiplier or leverage ratio) of 2.71.
- Three companies in the portfolio have BOTH net income margins AND asset turnover that are higher than the portfolio average. These three companies are KLA Corporation (Nasdaq: KLAC), which generated net income margins of 33% and asset turnover of 0.76, Netflix (Nasdaq: NFLX), which generated net income margins of 24% and asset turnover of 0.81, and Nvidia (Nasdaq: NVDA), which generated net profit margins of 56% and asset turnover of 1.04. Nvidia, at least for now, is clearly in a league of its own.
- The six companies in the portfolio with the highest ROE in 2025 were KLA with an ROE of 87%, Nvidia with an ROE of 76%, GE Aerospace (NYSE: GE) with an ROE of 46%, Carlisle Companies (NYSE: CSL) and Netflix tied with ROE of 41%, and GE Vernova (NYSE: GEV) with an ROE of 40%.
- The five companies in the portfolio with the lowest ROE in 2025 were Quanta (NYSE: PWR) with an ROE of 11%, Heico (NYSE: HEI) with an ROE of 14%, Linde (Nasdaq: LIN) with an ROE of 17%, Amazon (Nasdaq: AMZN) with an ROE of 19%, and Cadence Design Systems (Nasdaq: CDNS) with an ROE of 20%.
- 16 of the 22 businesses in the portfolio generated a 2025 ROE above 22%, which is the aggregate of the S&P 500. So, in 2025, 73% of the businesses in the portfolio had an ROE above the S&P 500.
- The average ROE of the Bastion Industrial and Infrastructure portfolio as of year-end 2024 was 40.8%. But Home Depot (NYSE: HD), a stock no longer in the portfolio, was an outlier with a 2024 ROE of 223%, driven by high asset turnover of 1.66 and extremely high asset-to-equity of 14.48. If I remove Home Depot as an outlier, then the portfolio’s average ROE in 2024 would have been 34%.
OK, now for some examples of how the DuPont analysis works in practice…
- Alphabet (Nasdaq: GOOGL) and Amphenol (NYSE: APH) both generated a 2025 ROE of 32%, and with very similar asset turnover. But Alphabet had net income margins of 33% (compared to Amphenol at 18%), but Amphenol had a leverage ratio (asset-to-equity) of 2.68 (compared to Alphabet at 1.43).
- Cintas (Nasdaq: CTAS) and Union Pacific (NYSE: UNP) both generated a 2025 ROE of 39%. But Cintas’s ROE was driven by net profit margins of 18%, asset turnover of 1.05, and an equity multiplier (asset-to-equity) of 2.10. Union Pacific’s same ROE of 39% was driven by net profit margins of 29%, asset turnover of 0.35, and asset-to-equity of 3.77.
- As mentioned above, Carlisle Companies and Netflix both generated 2025 ROE of 41%, and they did so with similar asset turnover. But Carlisle generated net income margins of 15% (compared to Netflix at 24%) and had a leverage ratio of 3.49 (compared to Netflix at 2.09).
- Finally, Arista Networks (NYSE: ANET) and United Rentals (NYSE: URI) both generated a 2025 ROE of 28%. But Arista’s ROE was driven by massive net income margins of 39%, with low asset turnover, and a leverage ratio of 1.57. But United Rentals had lower net income margins at 15% and a higher leverage ratio (equity multiplier) at 3.33.
Disclosure: John Rotonti is an investor in and the portfolio manager of the Bastion Industrial and Infrastructure portfolio which owns shares of KLA Corporation, Netflix, Nvidia, GE Aerospace, Carlisle Companies, GE Vernova, Quanta, Heico, Linde, Amazon, Cadence Design Systems, Alphabet, Amphenol, Cintas, Union Pacific, Arista Networks, and United Rentals. John personally owns shares of Home Depot.
Disclaimer: This article is intended for informational purposes only and does not constitute tax, financial, or legal advice. Investing carries risks, including potential loss of principal. Consult a qualified professional for personalized recommendations and to ensure compliance with applicable tax laws and regulations.