
After I published my recent note on how I think about Amphenol’s valuation, a couple of readers reached out to ask what I consider high returns on tangible invested capital (ROTIC). At the most basic level, I’m looking for a business that has a sustainable positive excess return spread, meaning the business is generating returns on invested capital (ROIC) above its cost of capital, and I must think it can continue to do so well into the future.
But beyond that, as with many questions in investing, the answer is “it depends” (on several factors which I won’t get into today), and there is more to analyzing ROIC and ROTIC than just looking for an absolute level over the trailing twelve months (TTM). Investors should also examine and analyze the trend line in returns over the last several years as well as any step changes in returns (sharp and dramatic jumps up or down). Importantly, investors need to understand what is driving the historical trend up or down and build conviction about whether you think the trend is sustainable or not, and why. If there was a step change in returns, investors need to understand what drove the dramatic shift higher or lower, and build conviction on whether this is a new normal or not, and why.
Some things I look for: (1) a long history of high and stable returns that I think are sustainable into the future, (2) a history of consistently rising returns that I think can either keep rising for period of time or that I think will stable out at this new higher level going forward, (3) or a step change in returns that makes sense to me and that I think is sustainable at the new, higher level.
I place great emphasis on the sustainability/durability of high returns because high ROIC is a driver of free cash flow conversion (free cash flow generated per dollar of earnings) and earnings growth, and stocks follow earnings up over time. Stock returns are highly correlated to ROIC and EPS growth over time. In other words, I’m looking to invest in businesses that generate high ROIC and ROTIC today and that I think (with high conviction) will maintain those high returns far into the future because I’m looking to invest in stocks that I think can deliver compounded returns over the next ten or twenty years (and hopefully longer).
And to build high conviction around the sustainability of ROIC, I try to only invest in businesses that I think have exceptional management teams and high barriers to entry with sustainable competitive advantages/moats (and often operating in industries with limited competition). These high barriers and wide and treacherous moats and management teams that are committed to investing to protect/defend the moats and high castle walls are what allows for high ROIC and ROTIC to remain high far into the future. To be clear, the advantage of the moat is that it protects the business’s high ROIC (profitability). In his 2007 letter Warren Buffet clearly stated, “A truly great business must have an enduring “moat” that protects excellent returns on invested capital.”
But to try to answer the readers’ questions directly, I generally consider ROTIC of at least 25% as “terrific.” Why? Because that is the level of return on net tangle assets that Buffett considers terrific.
There are some differences between return on tangible assets and return on tangible invested capital, but I tend to focus more on ROTIC because it is financing neutral (it can’t be boosted with debt like return on equity and return on assets can). Nevertheless, I examine all three return metrics, and I’ve adopted 25% ROTIC (if I think it’s sustainable) as a rough guide of what I consider an exceptional business.
In Warren Buffett’s letters from 2012 through 2016 he shared the average return on net tangible assets of Berkshire Hathaway’s wholly-owned subsidiaries operating in the manufacturing, service, and retailing industries (which includes all of Berkshire Hathaway’s owned businesses that did not fall under the category of insurance or regulated industries such as the railroad and utilities). In each of those letters Buffett described this group of businesses as “excellent” on average. According to Buffett, in 2012 and 2013 these businesses generated average return on tangible assets of around 16%-17%. In 2014 and 2015 the average return on tangible assets for that group of businesses jumped to around 18% to 19%. And in 2016 Buffett wrote that the average return on tangible assets for Berkshire’s manufacturing, services, and retailing operating companies jumped to 24%. (As a brief aside, the eagle-eyed reader will notice a trend line of returns up and to the right for Berkshire’s operating companies during this time period).
Below I am including the quotes from the 2012 letter (when this group of operating companies generated average return on tangible assets of 16.3%) and from the 2016 letter (when this group of operating companies generated average return on tangible assets of 24%).
- “The crowd of companies in this section sell products ranging from lollipops to jet airplanes. Some of the businesses enjoy terrific economics, measured by earnings on unleveraged net tangible assets that run from 25% after-tax to more than 100%. Others produce good returns in the area of 12-20%. A few, however, have very poor returns, a result of some serious mistakes I made in my job of capital allocation. More than 50 years ago, Charlie told me that it was far better to buy a wonderful business at a fair price than to buy a fair business at a wonderful price. Despite the compelling logic of his position, I have sometimes reverted to my old habit of bargain-hunting, with results ranging from tolerable to terrible. Fortunately, my mistakes have usually occurred when I made smaller purchases. Our large acquisitions have generally worked out well and, in a few cases, more than well. Viewed as a single entity, therefore, the companies in this group are an excellent business. They employ $22.6 billion of net tangible assets and, on that base, earned 16.3% after-tax.” – Buffett 2012 Letter
- “This collection of businesses is truly a motley crew. Some operations, measured by earnings on unleveraged net tangible assets, enjoy terrific returns that, in a couple of instances, exceed 100%. Most are solid businesses generating good returns in the area of 12% to 20%. A few, however – these are serious blunders I made in my job of capital allocation – produce very poor returns. In most cases, I was wrong when I originally sized up the economic characteristics of these companies or the industries in which they operate, and we are now paying the price for my misjudgments. In a couple of instances, I stumbled in assessing either the fidelity or ability of incumbent managers or ones I later put in place. I will commit more errors; you can count on that. Fortunately, Charlie – never bashful – is around to say “no” to my worst ideas. Viewed as a single entity, the companies in the manufacturing, service and retailing group are an excellent business. They employed an average of $24 billion of net tangible assets during 2016 and, despite their holding large quantities of excess cash and carrying very little debt, earned 24% after-tax on that capital.” – Buffett 2016 Letter
In a bit I’m going to share the ROTIC of seven companies in the Bastion Industrial and Infrastructure portfolio. But before I do that, I want to quickly review the differences between ROIC and ROTIC. ROIC is generally calculated as net operating profit after tax (NOPAT) divided by average invested capital. The DuPont Formula breaks down the drivers of ROIC into NOPAT margins (NOPAT divided by revenue), which is a measure of profitability, multiplied by invested capital turnover (revenue divided by average invested capital), which is a measure of balance sheet or capital efficiency. The two revenue components cancel each other out and the final ROIC formula is NOPAT over average invested capital. The DuPont model enables investors to determine whether a firm’s rise in ROIC is driven by a rise in NOPAT margins or a rise in invested capital turns or in some cases both (those companies are really firing on all cylinders). DuPont explains why a great company like Costco can generate sustainably high ROIC despite low margins…because it generates very high invested capital turnover. Or why a company like Verisign can generate high ROIC despite low invested capital turnover…because it generates extremely high profit margins.
ROTIC is calculated the same way as ROIC except goodwill and intangibles are subtracted from the denominator (from the invested capital part of the equation). For acquisitive businesses, there is often a big delta between ROIC and ROTIC, but both metrics are important to analyzing and valuing a business. ROIC includes the full cost of acquisitions and therefore measures management’s skill with capital allocation, but ROTIC is a better measure of the underlying profitability of the business and the returns generated from organic growth investments.
Here are two screen shots from the excellent book Buffett & Munger Unscripted by Alex Morris that show Warren Buffett explaining the difference between calculating returns both ways (keeping goodwill and intangibles in and taking them out) from the 2011 Berkshire Hathaway annual shareholder meeting:

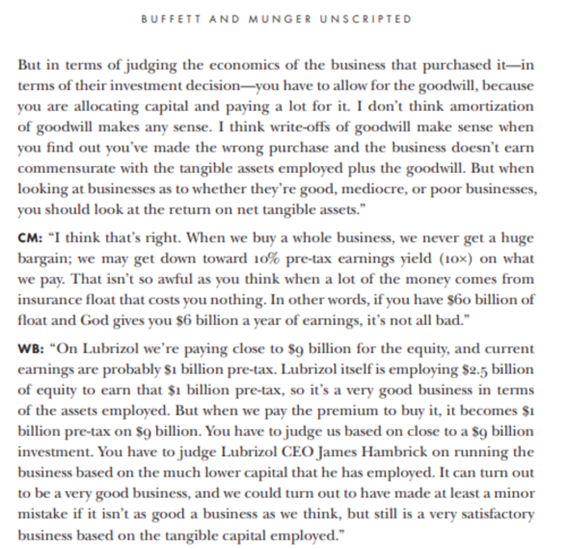
There are several additional Warren Buffett quotes suggesting (to me at least) that returns on some measure of tangible capital (whether it’s tangible invested capital, tangible assets, or tangible equity) is his preferred metric for measuring the quality of a business…
“Truly great businesses, earning huge returns on tangible assets, can’t for any extended period reinvest a large portion of their earnings internally at high rates of return.” – Buffett 2007 Letter
“In our search for new stand-alone businesses, the key qualities we seek are durable competitive strengths; able and high-grade management; good returns on the net tangible assets required to operate the business; opportunities for internal growth at attractive returns; and, finally, a sensible purchase price.” – Buffett 2017 Letter
“What we see in our holdings, rather, is an assembly of companies that we partly own and that, on a weighted basis, are earning about 20% on the net tangible equity capital required to run their businesses. These companies, also, earn their profits without employing excessive levels of debt.” – Buffett 2018 Letter
“We constantly seek to buy new businesses that meet three criteria. First, they must earn good returns on the net tangible capital required in their operation. Second, they must be run by able and honest managers. Finally, they must be available at a sensible price.” – Buffett 2019 Letter
“I believe I was right in concluding that PCC [Precision Cast Parts] would, over time, earn good returns on the net tangible assets deployed in its operations. I was wrong, however, in judging the average amount of future earnings and, consequently, wrong in my calculation of the proper price to pay for the business. PCC is far from my first error of that sort. But it’s a big one.” – Buffett 2020 Letter
“We own a small percentage of a dozen or so very large and highly profitable businesses with household names such as Apple, American Express, Coca-Cola and Moody’s. Many of these companies earn very high returns on the net tangible equity required for their operations.” – Buffett 2024 Letter
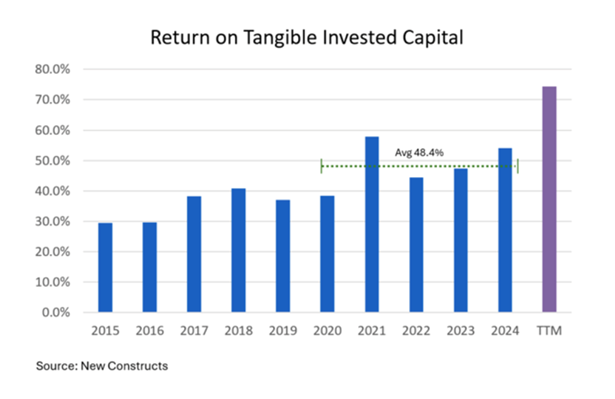
OK, rant done, and now for what you’ve probably all been waiting for. In my recent post on Amphenol I shared a chart showing that according to New Constructs Amphenol generated five-year average ROTIC of 48.4%. That’s really high…remember that Buffett considers a return on tangible assets of at least 25% as “terrific.” Well, Amphenol generates average ROTIC of nearly double that level. Here is that chart for Amphenol…
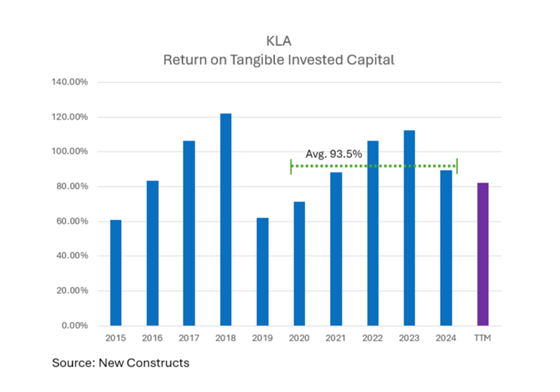
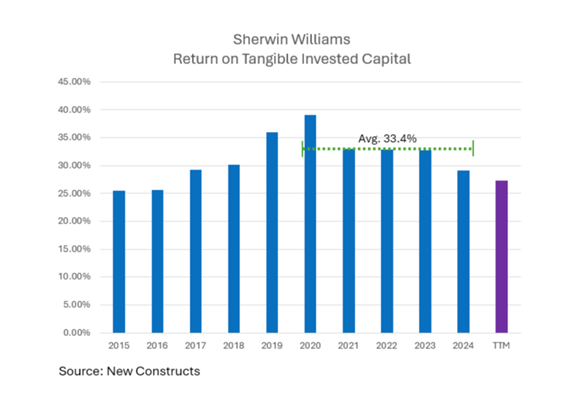
And below are the ROTIC charts from six additional holdings in the Bastion Industrial and Infrastructure portfolio (once again all of the numbers are coming from New Constructs). The lowest return business (of the six) is Eaton which generated five-year average ROTIC of 20%, but notice that Eaton’s ROTIC increased for four consecutive years (2020 though 2024) and its TTM ROTIC is still way above its five-year average. The highest return business (of this group of six) is KLA Corp with five-year average ROTIC of a whopping 93.5%.
The five-year average ROTIC of this group of seven businesses (which includes Amphenol, Carlisle Companies, Eaton, Installed Building Products, KLA Corp, Sherwin-Williams, and Trane Technologies) is 45%.
The Bastion Industrial and Infrastructure Portfolio currently has 28 stocks so 25% of the portfolio has a five-year average ROTIC of 45%. This is a very high return on invested capital portfolio (and I believe very high quality) and I think the ROIC of these companies will remain high for a long time to come (because of their moats and management and high barriers to entry and limited competition, etc.). And I think this will contribute to long-duration EPS growth for the portfolio. As I will stress as often as I can, in most cases the rate of EPS growth is less important to the way that I think about things than is the durability of EPS growth!
If you think that I cherry-picked the highest return companies in the Bastion Industrial and Infrastructure portfolio, that would not be the case. While it’s true that I have some lower ROIC businesses in the portfolio (such as more capital intensive businesses like railroads and industrial gases), we also hold Arista and Nvidia that, according to New Constructs, generate ROTIC of around 100% (or higher). Rather I chose these firms because I think they offer a good representation of the types of businesses I want to own (hopefully for a long time) in the Bastion strategy that I manage.


References: Buffett and Munger Unscripted by Alex Morris. Published on January 21, 2025. The screenshots I shared are from p. 273. Shared with permission from Alex Morris.
Disclosure: John Rotonti is an investor in and the portfolio manager of the Bastion Industrial and Infrastructure Portfolio, which owns shares of Amphenol, Arista, Carlisle Companies, Eaton, Installed Building Products, KLA Corporation, Nvidia, Sherwin-Williams, and Trane Technologies. John also personally owns shares of Apple, Berkshire Hathaway and Costco.
Disclaimer: This article is intended for informational purposes only and does not constitute tax, financial, or legal advice. Investing carries risks, including potential loss of principal. Consult a qualified professional for personalized recommendations and to ensure compliance with applicable tax laws and regulations.