 Thoughts on Valuation")
“I’ve always believed analysts need to be a little creative when they think about companies they should present on a comp sheet. One of my pet peeves is when an analyst is recommending the highest priced stock on the comparables sheet…The analyst will say that the stock deserves the highest multiple in the industry, and I’ll say it already has it! A question I will always ask is, “If these aren’t the right companies to compare to, who are the real comparables it should be priced like?” I want analysts to look beyond a specific industry and compare to companies with similar characteristics. An example would be American Express never looking cheap versus other credit card lenders. That’s because it’s a better business. American Express is part lender to extremely credit worthy customers, but part of it is similar to Mastercard and Visa, which trade at much higher multiples. American Express doesn’t have to sell cheaper than Capital One or Synchrony to be cheap.” – Bill Nygren, in my interview with him published at The Motley Fool on January 17, 2024
My Amphenol (NYSE: APH) notes from Q4:2024 and Q1:2025 are two of my most read newsletter reports. But one of my clients recently asked me how I get comfortable paying a P/E of around 30x to own shares of the business. I appreciate the question (and I encourage all my clients to challenge my thinking like this), so I thought I’d share my answer with all of you in this second note on how I think about valuation (the first note was emailed out as a newsletter and published to the discussion boards).
Before I start, let’s state the obvious…Amphenol is a high-multiple stock. It is currently trading at a NTM P/E of 32x, which is five turns above its long-term average. According to FinChat, over the past nine years, Amphenol stock has traded at an average NTM P/E of about 27x, with a minimum of 17x and a max of about 37x.
But I’m not sure historical P/E is the best measure of fair value in this case because Amphenol is a better business than in the past (and it was a superb business in the past IMO), with rising returns on invested capital (ROIC) and what I think is an accelerating and extended period of profit cycle growth.

Price-to-earnings (P/E) multiples are condensed discounted cash flow (DCF) calculations where P/E multiples are driven by return on incremental invested capital (ROIIC), net operating profit after tax (NOPAT) growth, and risk (which flows through the model as the weighted average cost of capital).
Let’s start with NOPAT growth. According to New Constructs, Amphenol generated NOPAT of about $716 million in 2014 and NOPAT of over $2.6 billion in 2024. So, that’s a ten-year NOPAT compounded annual growth rate (CAGR) of 14%. Textbooks and business school classes on corporate finance and valuation would lead you to believe that this level of growth for a 93-year old business is darn-near impossible. And maybe it is for most, but Amphenol is a special business that has defied financial gravity because of its decentralized, entrepreneurial culture (which is the antidote to poisonous bureaucratic bloat and lethargy) and its acquisition platform, which has enabled Amphenol to remain adaptable and agile across cycles and time.
Going forward, I’m only assuming NOPAT growth of around 10% (in my sort of base case), but it’s also possible Amphenol’s NOPAT growth actually accelerates above its historical average of 14% because of the electrification and electronification of the economy and the proliferation of AI, and a still fragmented interconnect market ripe for consolidation (more on Amphenol’s acquisitions in a bit).
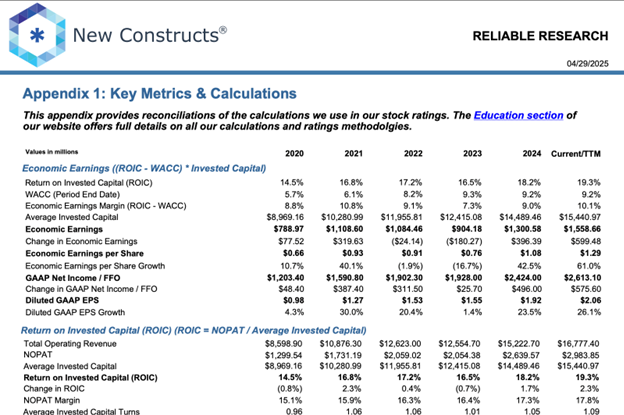
Let’s move onto the return on invested capital part of the equation. As you can see from the New Constructs table below, Amphenol generates high and rising ROICs. Amphenol’s ROIC increased in four of the last five years, growing from about 15% in 2020 to 19% in the trailing twelve months (TTM).
Additionally, Amphenol’s three-year rolling return on incremental invested capital is 26%. (To calculate that I did (2024 NOPAT of $2,639.57 minus 2021 NOPAT of $1,731.19) divided by (2023 invested capital of $12,415.08 minus 2020 invested capital of $8,969.16)). And because I think it has multiple sources of wide and durable moats and an elite management team that has proven successful at defending the moat(s), I think it can maintain ROIIC of around 25% (and possibly higher) going forward.
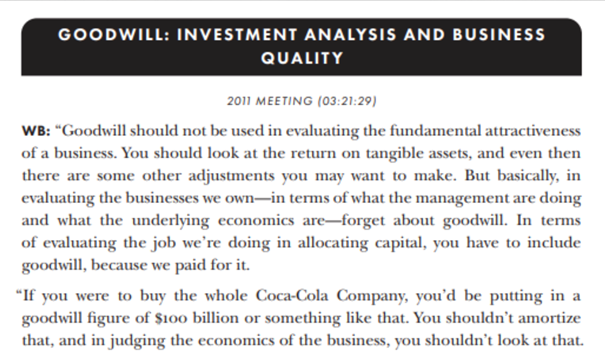
And because we’ve covered Amphenol’s ROIC and ROIIC, let’s also take a quick look at its return on tangible invested capital (ROTIC), which removes acquired goodwill and intangibles from the denominator. For acquisitive businesses, there is often a big delta between ROIC and ROTIC, but both metrics are important to analyzing and valuing a business. ROIC includes the full cost of acquisitions and therefore measures management’s skill with capital allocation, but ROTIC is a better measure of the underlying profitability of the business and the returns generated from organic growth investments.
Here are two screen shots from the excellent book Buffett & Munger Unscripted by Alex Morris that show Warren Buffett explaining the difference between calculating returns both ways (keeping goodwill and intangibles in and taking them out) from the 2011 Berkshire Hathaway annual shareholder meeting:

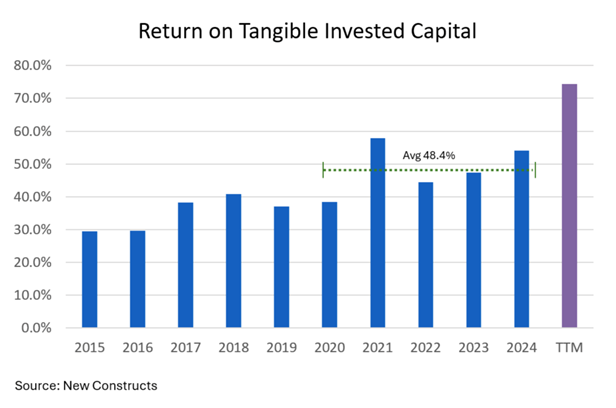
Well, Amphenol generates extremely high ROTIC. According to New Constructs, Amphenol generated five-year (2020 – 2024) average ROTIC of nearly 50% and its TTM ROIC jumped to 74%.
The final part of the justified P/E formula is Amphenol’s weighted average cost of capital (WACC), which you can see in the image below is 9.2% (note: it increased from around 6% in 2020 and 2021 because the fed funds rate was zero back then).
Well, when I run these three metrics though the formula, I get a justified (or fair) P/E for Amphenol of right around, you guessed it 32x (which is exactly where it is trading today). Now, I run a range of scenarios, so I think a fair value P/E range for Amphenol is somewhere between 25x and 35x. So, maybe today it’s trading a bit on the higher side of fair based on the warranted P/E equation. But I’m OK with that because I believe Amphenol is one of the highest quality, long-duration, profitable growth companies I’ve ever come across.
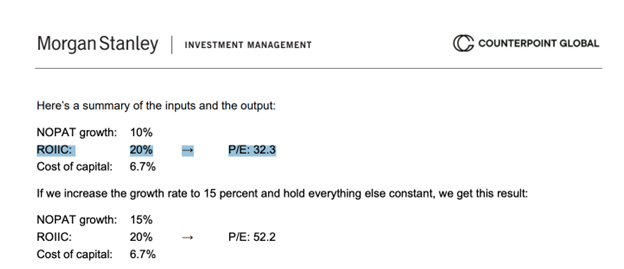
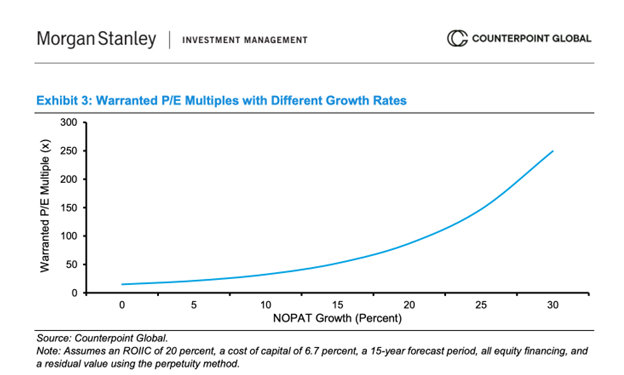
In June of 2020, Michael Mauboussin published a white paper titled The Math of Value and Growth where he demonstrated that a hypothetical business with very similar fundamentals to Amphenol deserves to trade at a P/E of 32x, and possibly higher. In the image below, Mauboussin used a cost of capital of 6.7% (because remember money was free at the time), and I’m using a cost of capital of 9% for Amphenol. All things equal, a higher cost of capital would spit out a lower P/E ratio. But, in his example Mauboussin used a ROIIC of 20% and I’m using 25%. If I keep NOPAT growth around 10%, then I think a fair P/E for Amphenol is right around 30x to 32x.
But, and this is important, when companies have high ROIIC (like Amphenol does), then growth becomes the primary driver of intrinsic (fair) value and P/E multiples, and the impact that even moderately higher growth rates can have on the fair (justified) P/E can be dramatic (see two charts below). Michael Mauboussin explains: “When ROIIC’s are well above the cost of capital, the value of the business is highly sensitive to changes in the growth rate of NOPAT. Exhibit 3 shows that the relationship between growth and the P/E is convex. Small changes in growth expectations can lead to large changes in the P/E, especially when growth rates are high.”
In other words, if Amphenol can grow its NOPAT at rates closer to its historical average of 14%, then I think its fair (justified) P/E is even higher than 32x. The following two charts come from Mauboussin’s seminal paper The Math of Value and Growth…
So, the justified P/E analysis that I just detailed is the first method I’m using to show you why I think Amphenol deserves to trade at a P/E of around 30x. The next valuation tool I’m going to use relates to that Bill Nygren quote that I put at the top of the page…that is, choosing the right comp group.
Amphenol sells interconnect technology solutions such as connectors, sensors, antennas, fiber optic cabling, and a range of other mission-critical products that are often custom-made for a particular project. Its product portfolio complexity, high switching costs (given the critical and custom nature of the products), global manufacturing scale, and deep long-term customer relationships (often placing engineers at a customer’s job site and manufacturing next to a customer’s location) are all sources of what I think are sustainable competitive advantages and provide Amphenol with pricing power. Amphenol’s products are similar to another of our portfolio holdings TE Connectivity (NYSE: TEL). Admittedly, TE Connectivity trades at a much lower P/E multiple than Amphenol, but TE Connectivity is growing slower, has lower returns on invested capital, and has less diversified end-market exposure with more cyclical auto business and less exposure to AI.
But I think Amphenol has additional, not-so-obvious sources of moat (competitive advantage) that I find to be extremely rare, and I think almost impossible to replicate. It is often these less obvious sources of moat that are hardest to replicate and hardest to account for in a model (and so the ones that often provide the most upside optionality). As Bill Nygren told me in a different interview all the way back in 2016, “I think that an advantaged corporate culture is the ‘moat’ that is most often available for free.”
Amphenol’s less obvious (even unconventional) sources of moat are its decentralized entrepreneurial corporate structure and culture as well as its acquisition platform (which is really an acquisition machine).
Amphenol is really 140 different, agile, adaptable, and independent businesses operating under the corporate umbrella. This enables it to innovate and bring new products to market quickly to meet its customers’ needs, but it also allows the company to quickly adapt to the unpredictable nature of markets, economies, and geopolitics.
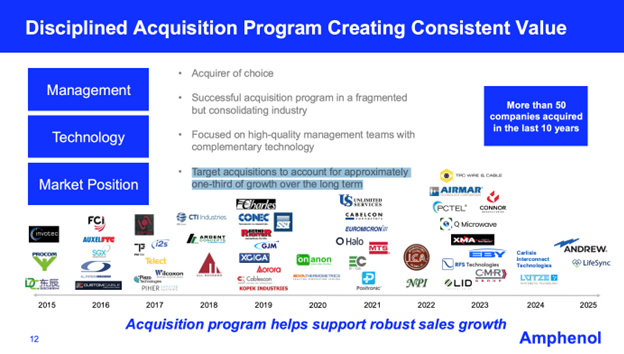
Additionally, Amphenol has made more than 50 acquisitions in the last 10 years, and about 1/3 of its revenue growth has historically come from acquisitions. Importantly, based on the way that I look at things, all those acquisitions do not dilute Amphenol’s ROICs. Rather, as emphasized above, Amphenol’s ROIC is consistently rising. I have found that most companies that do a lot of acquisitions see a consistent downward trend in ROIC because announcing M&A is easy. But paying the right price for M&A, and executing, and adding real, sustainable value through M&A (look at Amphenol’s 20-year stock chart below) is hard and differentiated. In the 2023 white paper titled Pattern Recognition, Michael Mauboussin wrote, “Historically, most M&A deals have failed to create value for the buyer, as measured by cumulative abnormal stock returns.”
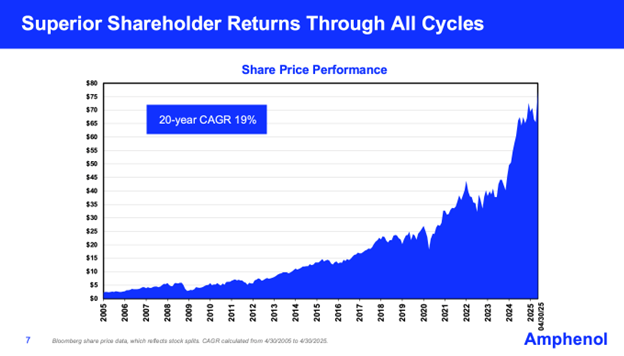
Amphenol is an M&A standout. It is the acquirer of choice because of its entrepreneurial culture…when it makes acquisitions it often keeps the existing management teams in place and gives them full autonomy to run their respective businesses. Amphenol is also the acquirer of choice because of its (1) strong balance sheet (which allows it to close on acquisitions quickly), (2) its acquisition playbook which allows it to insert the newly acquired products into its global supply chain/customer list and quickly improve the acquired company’s operating margins and working capital management (bringing them up to the corporate average), and (3) because of excellent long-term appreciation in Amphenol’s stock price (APH shares compounded at 19% annualized over the last 20 years).
How does a company founded in 1932 (almost 100 years old) defy conventional wisdom by continuing to grow at a mid-teens rate?
By maintain a decentralized entrepreneurial spirit and constantly adapting and future-proofing the business through mergers and acquisitions (M&A). I think Amphenol is positioned well because its organic growth is driven by the long-term tailwinds of digitization, electronification, and AI. And its acquisition platform provides it an additional growth engine (or growth lever) that further allows it to grow independent of the economy and GDP. Furthermore, Amphenol’s acquisition machine allows it to play offense during economic downturns by acquiring companies at discounted valuations, which plants the seeds for accelerating growth, higher market share, and even wider moats coming out of the downturn. Companies that have this twin turbo engine of secular organic demand and inorganic growth via an acquisition machine can maintain above-average growth for much longer than the market expects. For this reason, I think Amphenol is still in the early stages of an extended profit cycle and therefore deserves to trade at the premium P/E.
And for this reason, I think the most appropriate comp group for Amphenol are other high-quality, profitable growth, superbly-managed, entrepreneurial organizations that grow through acquisitions (in other words, they have built-in acquisition machines).
And here is that comp group that I came up with…
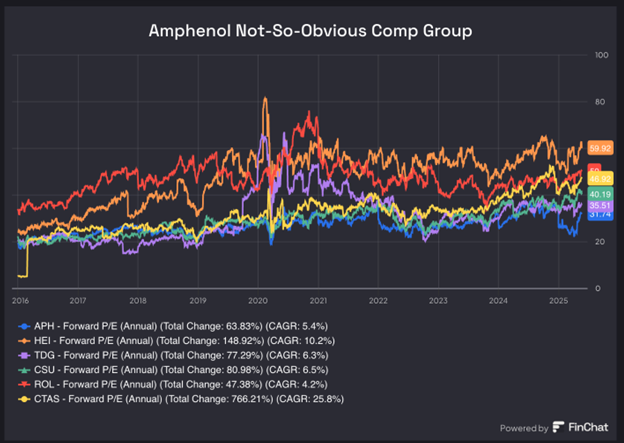

The individual NTM P/Es for the comp group I chose are Transdigm at 35.51, Constellation Software at 40.19, Cintas at 46.92, Rollins at 50, Heico at 59.92, and then the outlier, CoStar, at 81.27x. If I keep CoStar out, then the average NTM P/E of the comp group is nearly 47x. So, based on this analysis, Amphenol trades at a discount to the comp average of 47x and at a discount to the next lowest P/E on the list of 35.5x. (BTW, if I include CoStar, then the comp average NTM P/E jumps to 52x, which is the exact same P/E that Mauboussin said is justified for the faster growing, high ROIIC business in his hypothetical example above. This is just a coincidence, but cool and neat so I thought I’d point that out just for fun).
As I start to wrap this up, I’m not saying Amphenol stock is cheap today. It clearly is not (I think cheap would be getting this thing at a market multiple). I’m saying I think it’s fairly valued, meaning that I think annualized total shareholder returns (TSR) will be mostly driven by the dividend yield and the rate of EPS growth (possibly minus some P/E multiple contraction over time). When I buy into a fairly valued stock, my margin of safety is not going to come from a discounted valuation.
Rather, I’ve got to believe that my margin of safety is based on the quality of the business and the quality of the management team, and I’ve got to believe there is a very long duration of per-share growth. In other words, the sustainable moat(s) and world-class leadership are my margins of safety. I’ve been investing this way a long time. Over seven years ago in March of 2018 I published an article for Motley Fool subscribers titled When is ‘Fair Value’ Really ‘Undervalued’?.
Here is what I wrote…
“For high- quality, growing companies powered by long-term tailwinds, it [starting valuation] matters less. And in those cases, we have to take a business-minded approach, holding the shares as if we owned 100% of the business — for a very long time. The longer we hold a high-quality, growing business that compounds its value, the less our initial purchase price will matter to our long-term returns. I’m arguing that you’re most likely to create long-term wealth when you own stock in the best businesses in the world, and when you keep owning it for as long as those businesses remain great (with high returns on invested capital and above-average growth) and maintain sane valuations that don’t balloon to ridiculous levels. I don’t think, in these cases, that you need to focus so much on margin of safety in the traditional sense… These kinds of “wonderful” businesses are often easy to spot, which means they tend to trade at premium, above-average valuation multiples… But there is a lot of research (from sources including Bank of America Merrill Lynch, Wells Fargo Asset Management, Fidelity, Alliance Bernstein, and Morgan Stanley) that shows that quality businesses outperform the market over long periods of time. That means that the high multiples investors pay for quality are often not high enough… shareholder returns (or wealth creation) will be determined more by the size of a company’s moat than by the size of the margin of safety. In other words, for high-quality businesses, a sustainable moat is the margin of safety… I’m not worried about waiting for a traditional margin of safety because my true margin of safety will come from business quality and compounding value.”
My point is that valuing something that is great and growing (profitably) for a long time to come, and critical and rare, like I think Amphenol is, is very hard to do. And I think the tendency of most value investors (myself included at times) is to undervalue greatness because greatness (and the optionality that comes with it) is really hard to model. A few (a small percentage) of the businesses that look most expensive today (and Amphenol doesn’t even fall into this category because it’s not that expensive, but I’ve started ranting so I’m going to bring this thought to a conclusion) will end up being the most undervalued with the most market outperformance over a long period of time.
And while a NTM P/E of 32x is high, I (1) think its justified based on the fundamentals of the business, (2) it trades at a large discount to what I think is a reasonably-chosen comp group, and (3) the P/E drops to about 21x on five-year out numbers if EPS only grows at 10% per year (which is the low end of my estimated range).
So, what is the right P/E multiple for a company like Amphenol with the following characteristics?
- A healthy balance sheet with a debt-to-capital of only about 40%, net debt-to-EBITDA of 1.2x, and interest coverage (EBIT/interest expense) of 15x.
- Incremental operating margins of 25%+.
- High and rising ROIC with TTM ROIC of 19%.
- Rolling returns on incremental invested capital of 26%.
- Five-year average (2020 – 2024) return on tangible invested capital (ROTIC) of 48%.
- Rising returns on tangible invested capital with 2024 ROTIC of 54% and trailing twelve-month (TTM) ROTIC of 74%.
- High(ish) inside ownership. CEO Adam Norwitt owns about $220 million worth of Amphenol shares and insiders own over $500 million, according to FinChat.
- A diverse and stable business with attractive organic growth powered by long-term tailwinds.
- And a world-class management team, decentralized culture, multiple sources of overlapping moats resulting in pricing power, and unique M&A prowess.
Disclosure: John Rotonti is an investor in and the portfolio manager of the Bastion Industrials and Infrastructure Portfolio, which owns shares of Amphenol and TE Connectivity. John Rotonti also personally owns shares of Rollins.
Sources:
- Read more about Amphenol here… https://lastbastion.com/2025/04/30/jros-notes-amphenol-q12025-earnings/
- Amphenol May 2025 Investor Presentation… https://s21.q4cdn.com/564806605/files/doc_events/2025/May/13/APH-Investor-Presentation-May-2025.pdf
- Bill Nygren Interview from 2024… https://www.fool.com/investing/2024/01/17/next-great-value-stock-bill-nygren-explains/
- Bill Nygren Interview from 2016… https://www.fool.com/investing/general/2016/03/31/interview-with-bill-nygren-of-oakmark-funds.aspx
- The Math of Value and Growth from Michael Mauboussin… https://www.morganstanley.com/im/en-ch/intermediary-investor/insights/articles/the-math-of-value-and-growth.html
- Pattern Recognition from Michael Mauboussin… https://www.morganstanley.com/im/en-ch/intermediary-investor/insights/articles/pattern-recognition.html
Disclaimer: This article is intended for informational purposes only and does not constitute tax, financial, or legal advice. Investing carries risks, including potential loss of principal. Consult a qualified professional for personalized recommendations and to ensure compliance with applicable tax laws and regulations.